Test Maintenance Cost Calculator: What's Your Hidden QA Tax?
AI writes code faster than you can test it, and maintenance is the bill nobody budgets. Price your hidden QA tax in 5 steps, then run it in our calculator.

Nobody budgets for test maintenance. You budget for the people and tools it takes to write the suite, leadership signs off on a reasonable-looking spreadsheet, and the suite gets written. What never makes the spreadsheet is the cost of keeping those tests alive once they exist, and it is the cost most often left out.
AI now writes a growing share of your code, which can mean the app under your tests changes faster than it did. Here is how to put a number on what that costs you.
What you’ll learn
- Where your automation budget ends up once the suite is built
- Why AI-generated code is pushing test maintenance costs up right now
- A 5-step framework that turns your team’s upkeep into the number our calculator needs
- Why the fix is architectural, not just better test hygiene
Where the Maintenance Tax Hides
Test maintenance never gets its own line in the engineering budget. It is the ongoing cost of keeping an automated suite passing while the app it tests keeps shipping, and it hides inside other categories, which is exactly why it grows unchecked.
You see the symptoms long before you see the cost:
- Sprint velocity slips without a clear reason.
- Senior engineers get pulled into “test stabilization” work every sprint.
- QA cycles stretch a little longer each release.
- Features ship without coverage because “we didn’t have time.”
Over time the investment quietly shifts from building new coverage to keeping old tests from breaking, and because nobody puts a number on that shift, the maintenance share climbs until it crowds out the work the suite was supposed to enable.
Ask a QA engineer how much time goes to keeping automated tests alive and you may get a shrug. One senior QA engineer we spoke to said it was hard to answer, and that it was not one of their main pain points. Their weekly manual regression took about one person-day. If you can name your number, check it against the steps below. If you cannot, nobody is counting, and that is the tax.
Why AI-Written Code Makes the Bill Bigger
If your engineers have Cursor or Claude Code open all day, the app under your tests is changing faster than it used to. Each of those changes lands on a suite written against last month’s screens.
We see it a lot with products expanding this quickly. Even maintaining the automation you already have starts taking a lot longer. AI will happily write more tests for you, and writing them was always the easy part. Keeping them working release after release is where the hours go, and those hours are still your team’s.
Google’s DORA research found that more AI adoption went with less stable delivery, in 2024 and again in 2025. DORA doesn’t measure test maintenance, so treat it as pressure on your suite and price the bill itself with the steps below. The longer argument is in why testing is the bottleneck now that AI writes the code, and the bugs that get through are in testing AI-generated code.
Maintenance cost is roughly how brittle your tests are, multiplied by how often the app changes. Selector-based tests fixed the first input years ago at “very brittle,” and AI-generated code can push the second one up.
Why Maintenance Costs Compound
Test maintenance compounds, because the suite grows while the app keeps moving under it. Picture one suite two years apart. These are illustrative numbers, not a benchmark.
Year one: 500 tests and roughly 5 hours a week of upkeep. Manageable, easy to wave off.
Year three: 2,000 tests. The app has been refactored twice, the frontend framework upgraded, three services added, and a growing share of the diffs are AI-authored. Upkeep is 40-plus hours a week, eight times year one on four times the tests. A full-time engineer, doing nothing but keeping tests green.
Three forces drive the curve, and they stack:
- UI churn: Redesigns, component refactors, and CSS updates break selector-based tests in waves. Most of those failures are maintenance work. Few of them are bugs.
- Flaky tests: Timing and environment issues produce false failures a human has to triage before anyone trusts the result. Flakiness is a tax even when the fix is “re-run it,” because re-running a flaky pipeline has its own compute and delay cost.
- Suite growth: More coverage means more surface area to keep passing. Growth that felt like progress becomes growth in liabilities.
Left alone, the maintenance share of your QA budget only moves one direction. It is the trap teams walk into when they add more QA engineers to outrun the work, because each hire adds one person’s hours while the work compounds.
How to Calculate Your Maintenance Cost in 5 Steps
You cannot manage what you have not measured, and “our tests take a lot of time” is not a number anyone can act on. The five steps below turn it into a defensible annual figure. Track them over two weeks of real work, then annualize.
Walking the five steps once shows you where the number comes from. The calculator needs four figures (team size, loaded hourly cost, weekly testing hours, and weekly maintenance hours per person), and Steps 1 through 3 produce the last one.
Step 1: Track Failure Investigation Time
For two weeks, have the team log time spent investigating test failures. Not fixing bugs. Working out whether a red test is a real issue or noise. The worked example below assumes 4 hours per engineer per week.
For scale, a five-year study of a commercial project with about 30 developers, presented at ICST 2024, put investigating potentially flaky failures at 1.1 percent of productive developer time. Four hours is ten percent of a 40-hour week, so this example assumes a far noisier suite than that one.
One engineering manager told us their nightly runs pass 96 to 97 percent of the time, and yet their engineers spend at least a few hours every day running the red ones locally to check nothing is really wrong. A pass rate like that can hide this line, so log it rather than guess. Multiply by team size and your loaded hourly cost.
4 hrs/week × 20 engineers × $90/hr × 52 weeks = $374,400/year
Step 2: Measure Test Fix Effort
Track how many tests need fixing each sprint and the average time per fix. Say 15 tests a sprint at half an hour each. Call it 7.5 hours of pure maintenance every two weeks, and it is the line AI-generated churn feeds most directly.
15 tests/sprint × 0.5 hrs × $90/hr × 26 sprints = $17,550/year
Step 3: Quantify Re-run Costs
Count the CI minutes lost to re-running flaky tests, plus the wait. If your pipeline takes 10 minutes and, across a 20-person team, someone re-runs it a dozen times a day just to clear a flaky failure, that is two hours of waiting a day, around 10 hours a week.
10 hrs/week in pipeline re-runs × $90/hr × 52 weeks = $46,800/year
Step 4: List the Opportunity Cost
Which features did not ship because engineers were fixing tests? Which coverage never got built because the team was maintaining what already existed? This is the hardest number to pin down, and the easiest one to leave out.
A senior engineer who loses an afternoon a week to test duty is losing hours you already priced in Steps 1 and 2, so do not add them again. What this step adds is a list of the features and coverage that slipped because of that time. Keep it next to the total, because the dollars understate it.
Step 5: Convert the Total Into Your Calculator Input
Add the three priced categories up, and leave opportunity cost out of the sum:
- Investigation time × 52 weeks
- Fix effort × 26 sprints
- Re-run costs × 52 weeks
Together they give a team-wide annual figure. The calculator works per person per week, so divide your weekly total by headcount before you enter it. It also asks for weekly testing hours, the time each person spends running tests by hand, and adds them to the same bill. The worked example below runs the conversion end to end.
Example: 20-Person Engineering Team
| Category | Weekly Hours | Annual Hours | Cost @ $90/hr |
|---|---|---|---|
| Failure investigation | 80 | 4,160 | $374,400 |
| Test fixes | 3.75 | 195 | $17,550 |
| Re-run wait time | 10 | 520 | $46,800 |
| Total | 93.75 | 4,875 | $438,750 |
Over $400,000 a year on these assumed inputs, for a 20-person team, just to keep the suite from falling apart. Your inputs will differ, and the first line is the one to measure.
Spread across 20 engineers, 93.75 hours a week is about 4.7 maintenance hours per person. Enter that and your own loaded rate in the savings calculator. It adds your weekly testing hours and multiplies by people, 52 weeks and your rate, then estimates how much of that budget Pie could free up. The testing-hours field starts at 5, so set it to 0 to match the table. Next time, a careful estimate gets you there without the two-week logging exercise Step 1 asks for.
Tired of the Maintenance Tax?
Send us a staging URL. Watch the suite run with no selectors to write.
Why the Fix Is Architecture, Not Effort
Most maintenance advice treats the symptom. Write more stable selectors, add retries, quarantine the flaky ones, prune the suite every quarter. All of it helps at the margin, and it is worth doing.
None of it removes the reason tests break, which is that the test is pinned to how the app is built rather than how it looks. What your tests are bound to decides what a normal week of shipping costs you.
| Approach | What breaks a test | Maintenance profile |
|---|---|---|
| Selector-based scripts (Selenium, Cypress) | A change to any ID, class, or DOM path the test targets | High and compounding |
| Component tests | Prop and contract changes, and it misses full user flows | Lower, but partial coverage |
| Selector-based self-healing | Locators are re-matched, but the test stays tied to selectors | Reduced, root cause remains |
| Vision-based autonomous | A change to what the user sees, or to the behavior the test checks | No locators to repair; steps still change when behavior does |
The tighter a test is coupled to implementation details, the more every UI change costs. Managing tests better trims the bill. Changing what the tests depend on goes after the root cause, which is the premise behind an autonomous approach to QA.
Why Selector-Based Tests Break Every Sprint
A selector-based test says “click the element with ID submit-btn-primary.” Rename that ID in a refactor, or let an AI assistant regenerate the component, and the test fails even though nothing a user cares about changed. The more actively your product evolves, the more maintenance your tests demand. The teams shipping fastest pay the highest tax.
What Vision-Based Testing Changes
Vision-based testing identifies elements the way a person does, by how they look and where they sit on the screen. When the underlying code moves, the test can keep working. Nobody on your team writes or maintains a selector, and that single change flips the maintenance equation:
- No selector dependencies: Refactor a component or rename its classes, and the button keeps looking like a submit button for the test to find.
- Self-healing by design: When an element shifts or changes appearance slightly, the agent can still find it from what is on screen, and nobody on your team writes a fallback locator.
- Framework agnostic: Migrating React to Vue, or Bootstrap to Tailwind, need not touch a test that operates at the rendered UI layer.
Pie is an agentic testing platform built this way, part of a category Forrester now tracks in its own Wave. The agents explore your app and build the suite from what a user sees. A refactor that would have taken out a wave of selectors leaves your team no selectors to patch in supported tests.
When a flow’s intended behavior changes, you edit that test’s steps in plain English and rerun it. The people who own quality keep owning it, with the patching taken off their plate.
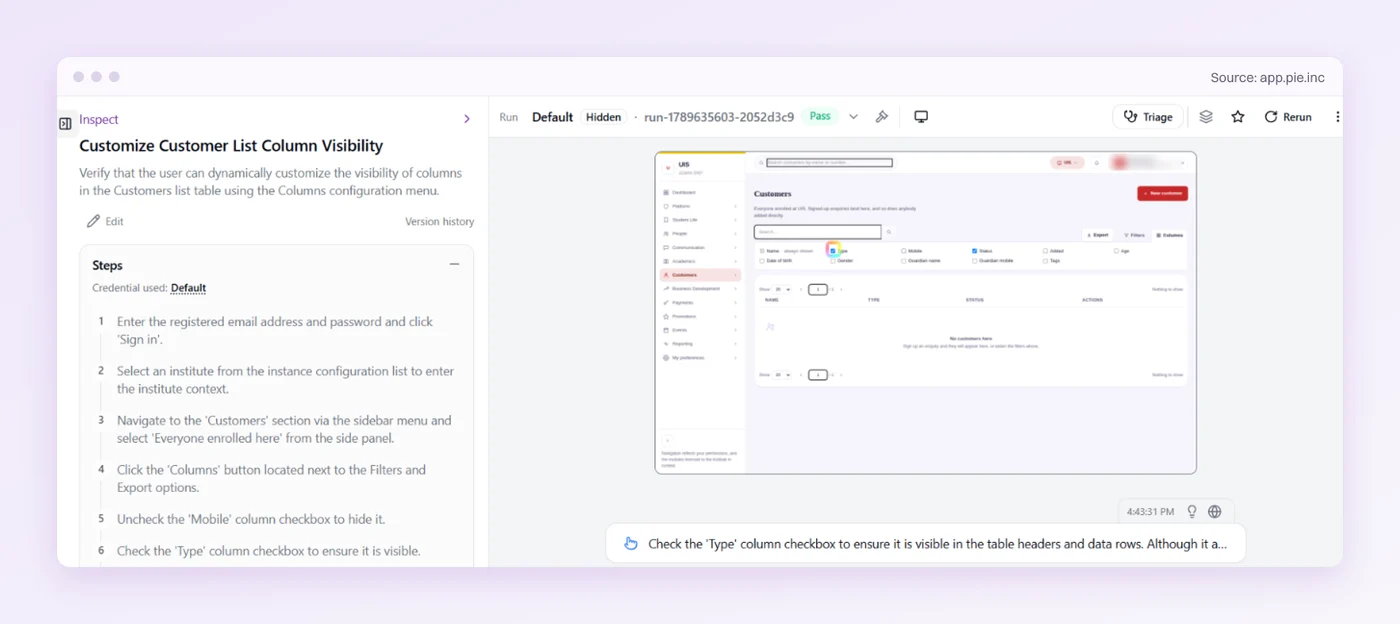
What It Looked Like at Fi
Fi makes smart GPS collars that track the location and health of millions of pets. Before Pie, release validation at Fi meant engineers locked in a room, testing by hand. Coverage stopped at the core smoke tests, because nobody had the bandwidth to go past the critical paths.
With Pie running the suite, testing went past those smoke tests into edge cases the team didn’t know existed. Nobody writes or maintains a selector for the tests Pie runs, so there is no selector repair to price for them. Fi’s CEO explained why that matters as the product line grows.
”As we scale our products and offerings it’s really important to make sure we don’t ship something that breaks the existing experience for our users.”
— Jonathan Bensamoun, CEO, Fi5 Questions to Ask Before Your Next Automation Investment
Quantify the burden before you spend another dollar automating. Without answers to these, you are investing blind:
- How many hours a week does your team spend on test work that is not finding real bugs?
- What is your flake rate, and how often do pipelines get re-run “just to be sure”?
- How many tests are quarantined or disabled right now?
- When did you last delete tests because maintaining them was not worth the coverage?
- If AI keeps writing more of your code next year, what happens to your maintenance bill?
If you do not like the answers, you have two paths. Keep tuning around the edges, or remove the root cause.
Stop Paying a Tax You Never Signed Up For
On a selector-bound suite, a UI change often gets paid for twice, once to build it and once to repair the tests it broke. AI now ships those changes at a pace no hiring plan can match. You can keep paying senior engineers to patch the tests, or you can change what your tests depend on.
Pie’s agents test your app the way a user sees it, so for supported tests nobody has to keep coverage alive one selector at a time.
Run the five steps or the calculator and look at the figure as a line item. Then ask who on your team is paying it, and what they would build with that time back.
Less Maintenance. More Shipping.
Bring the number you just calculated. Your engineers get time back for product.
Frequently Asked Questions
Track three costs for two weeks and annualize them. Count the hours spent investigating failures that turn out not to be bugs, the hours fixing tests after UI changes, and the pipeline re-runs.
List the feature work those hours displaced beside the total. The worked example lands a 20-person team above $400,000 a year.
Spent a decade in B2B SaaS sales before building Pie. Now obsessed with helping engineering teams ship without the fear of breaking things. LinkedIn →